
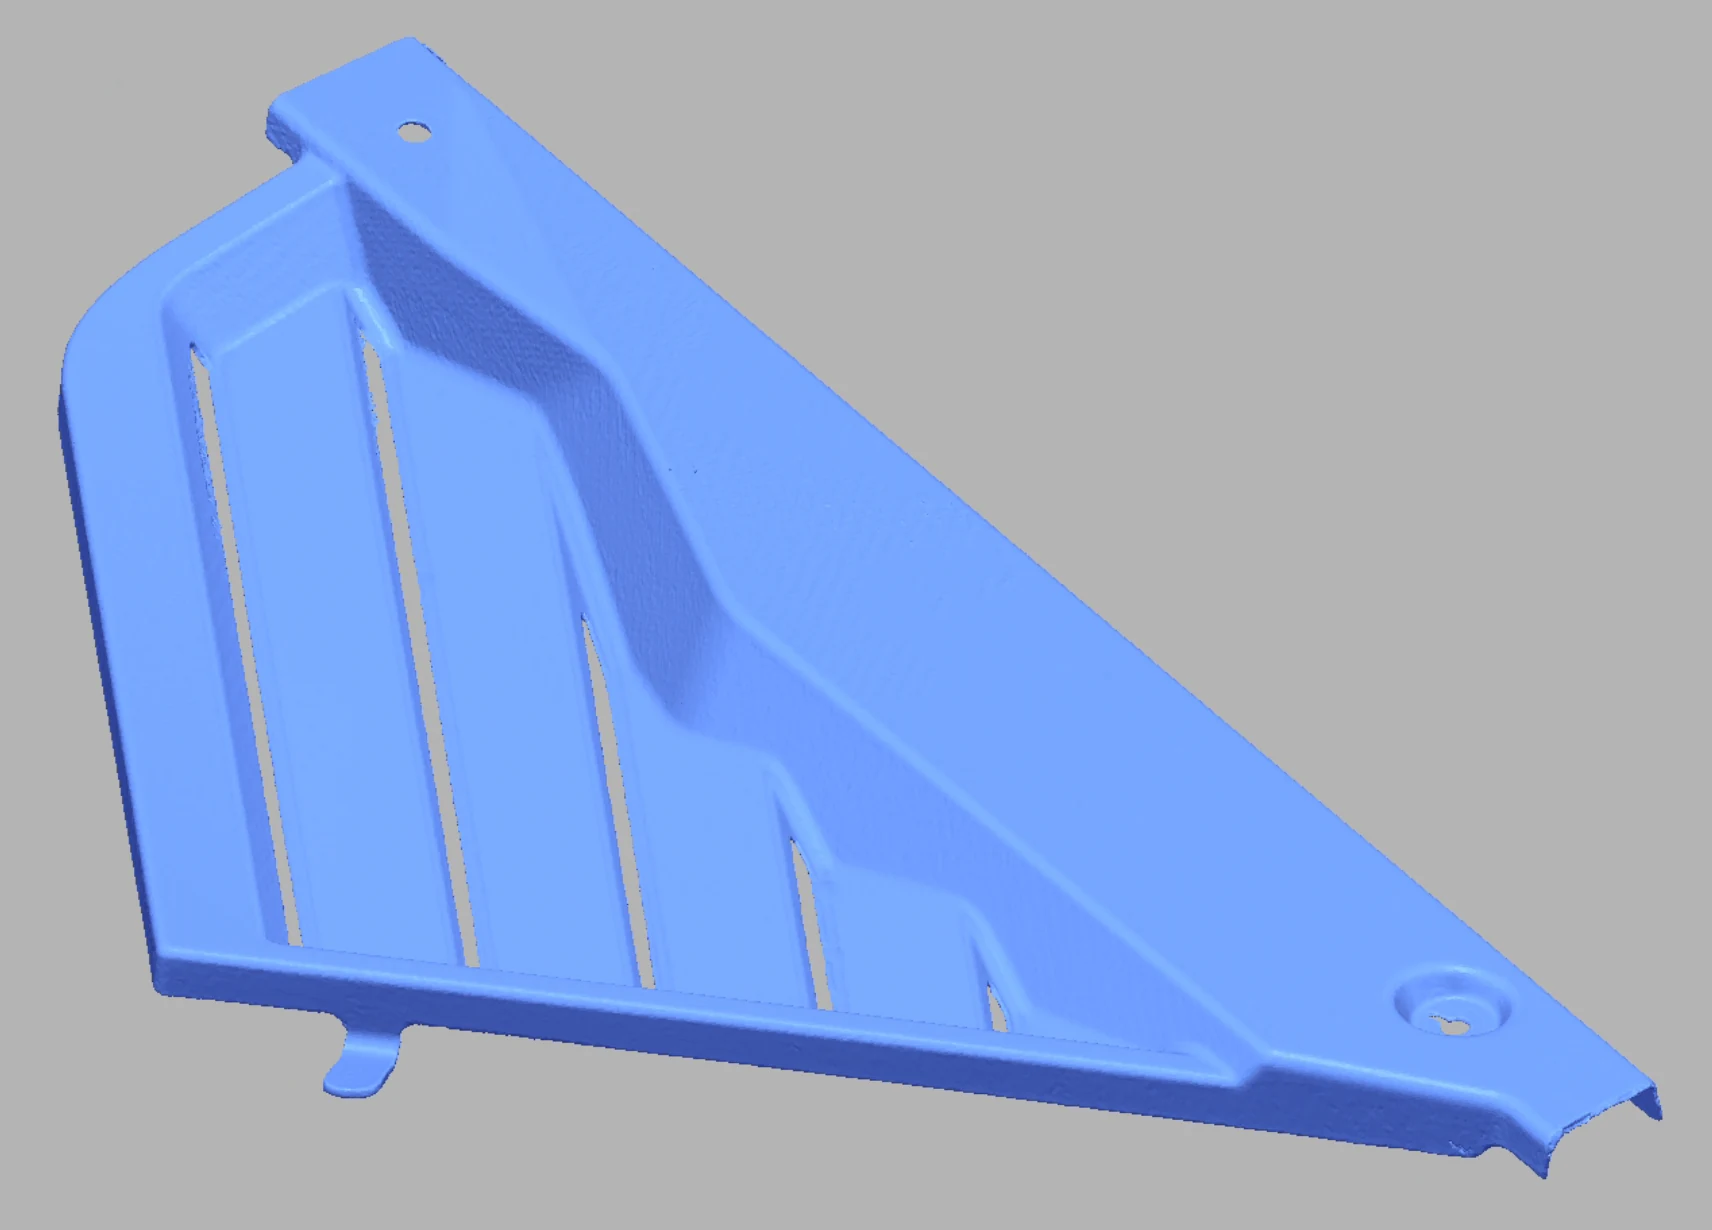
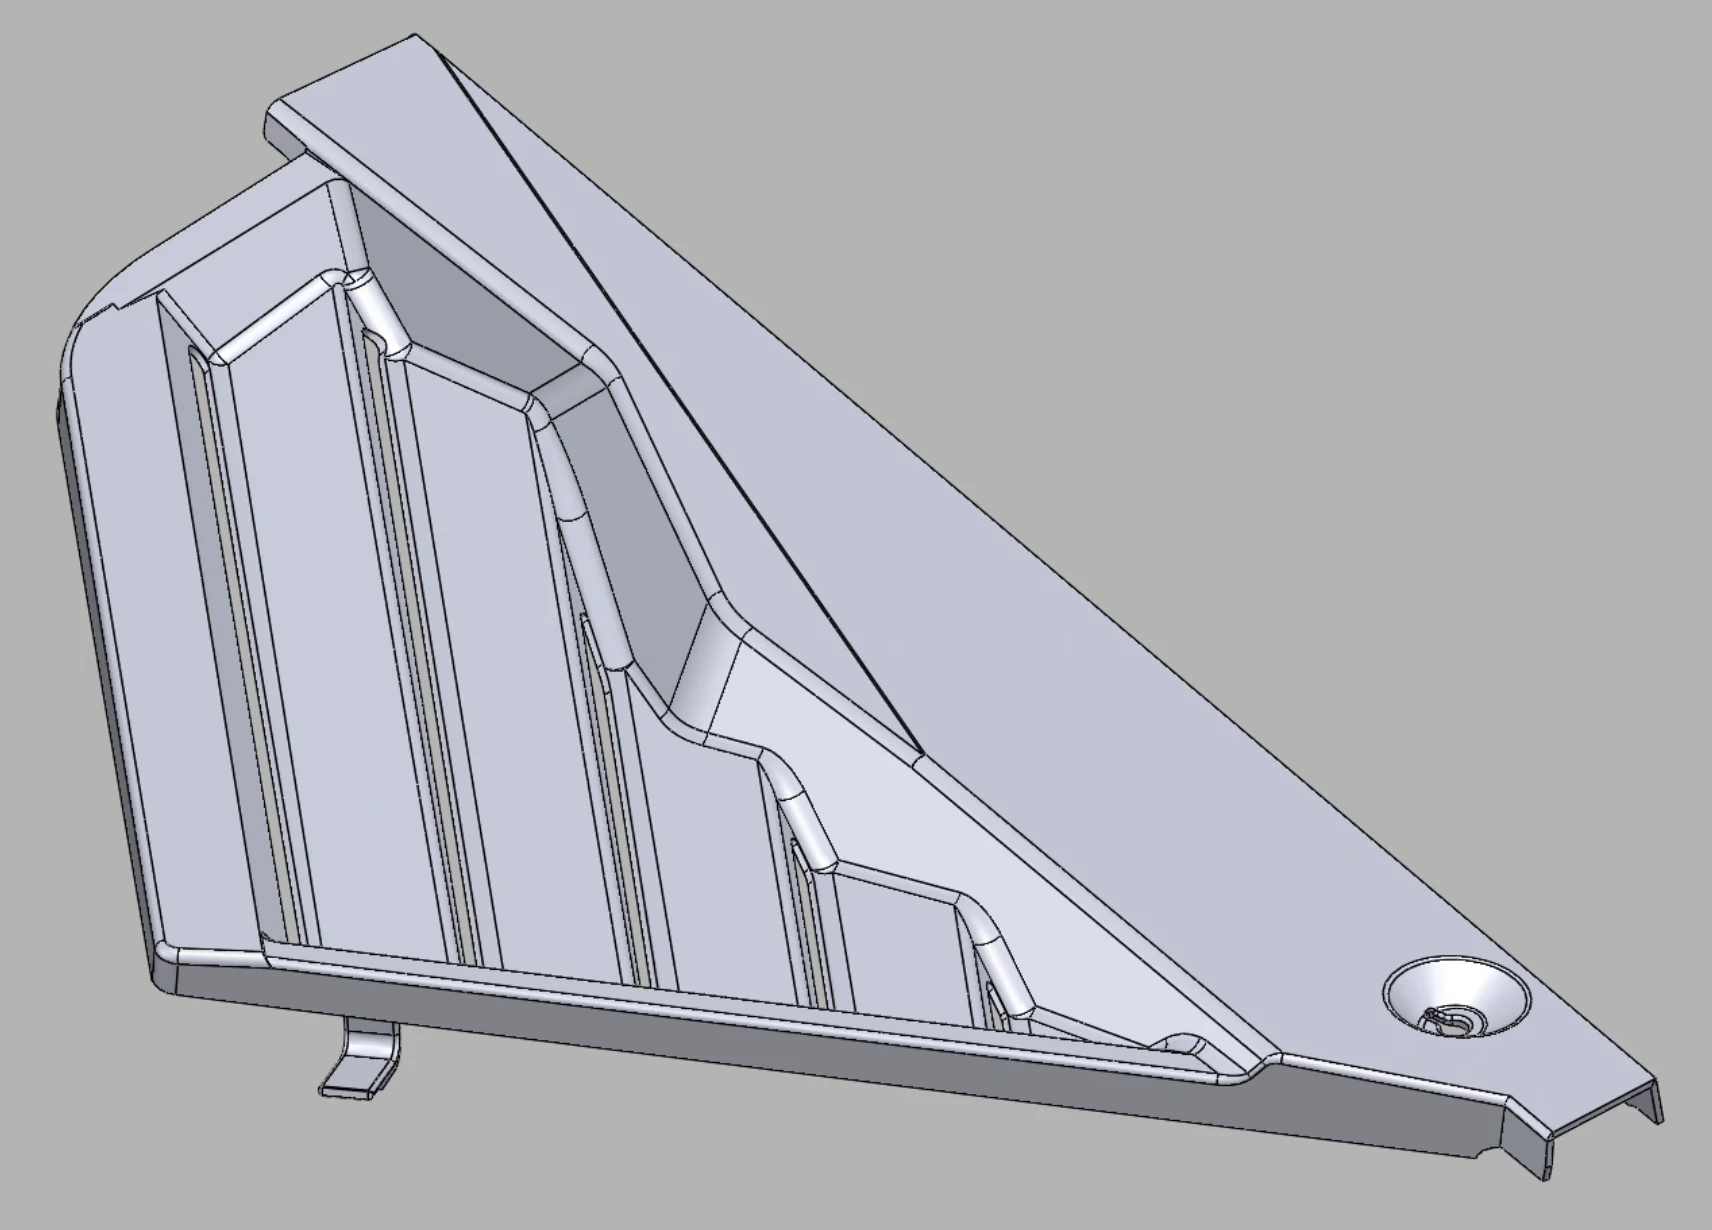
Scan data → CAD reconstruction
Move the slider to see the relationship between the captured scan image and the reconstructed CAD example.
01 Scan02 CAD
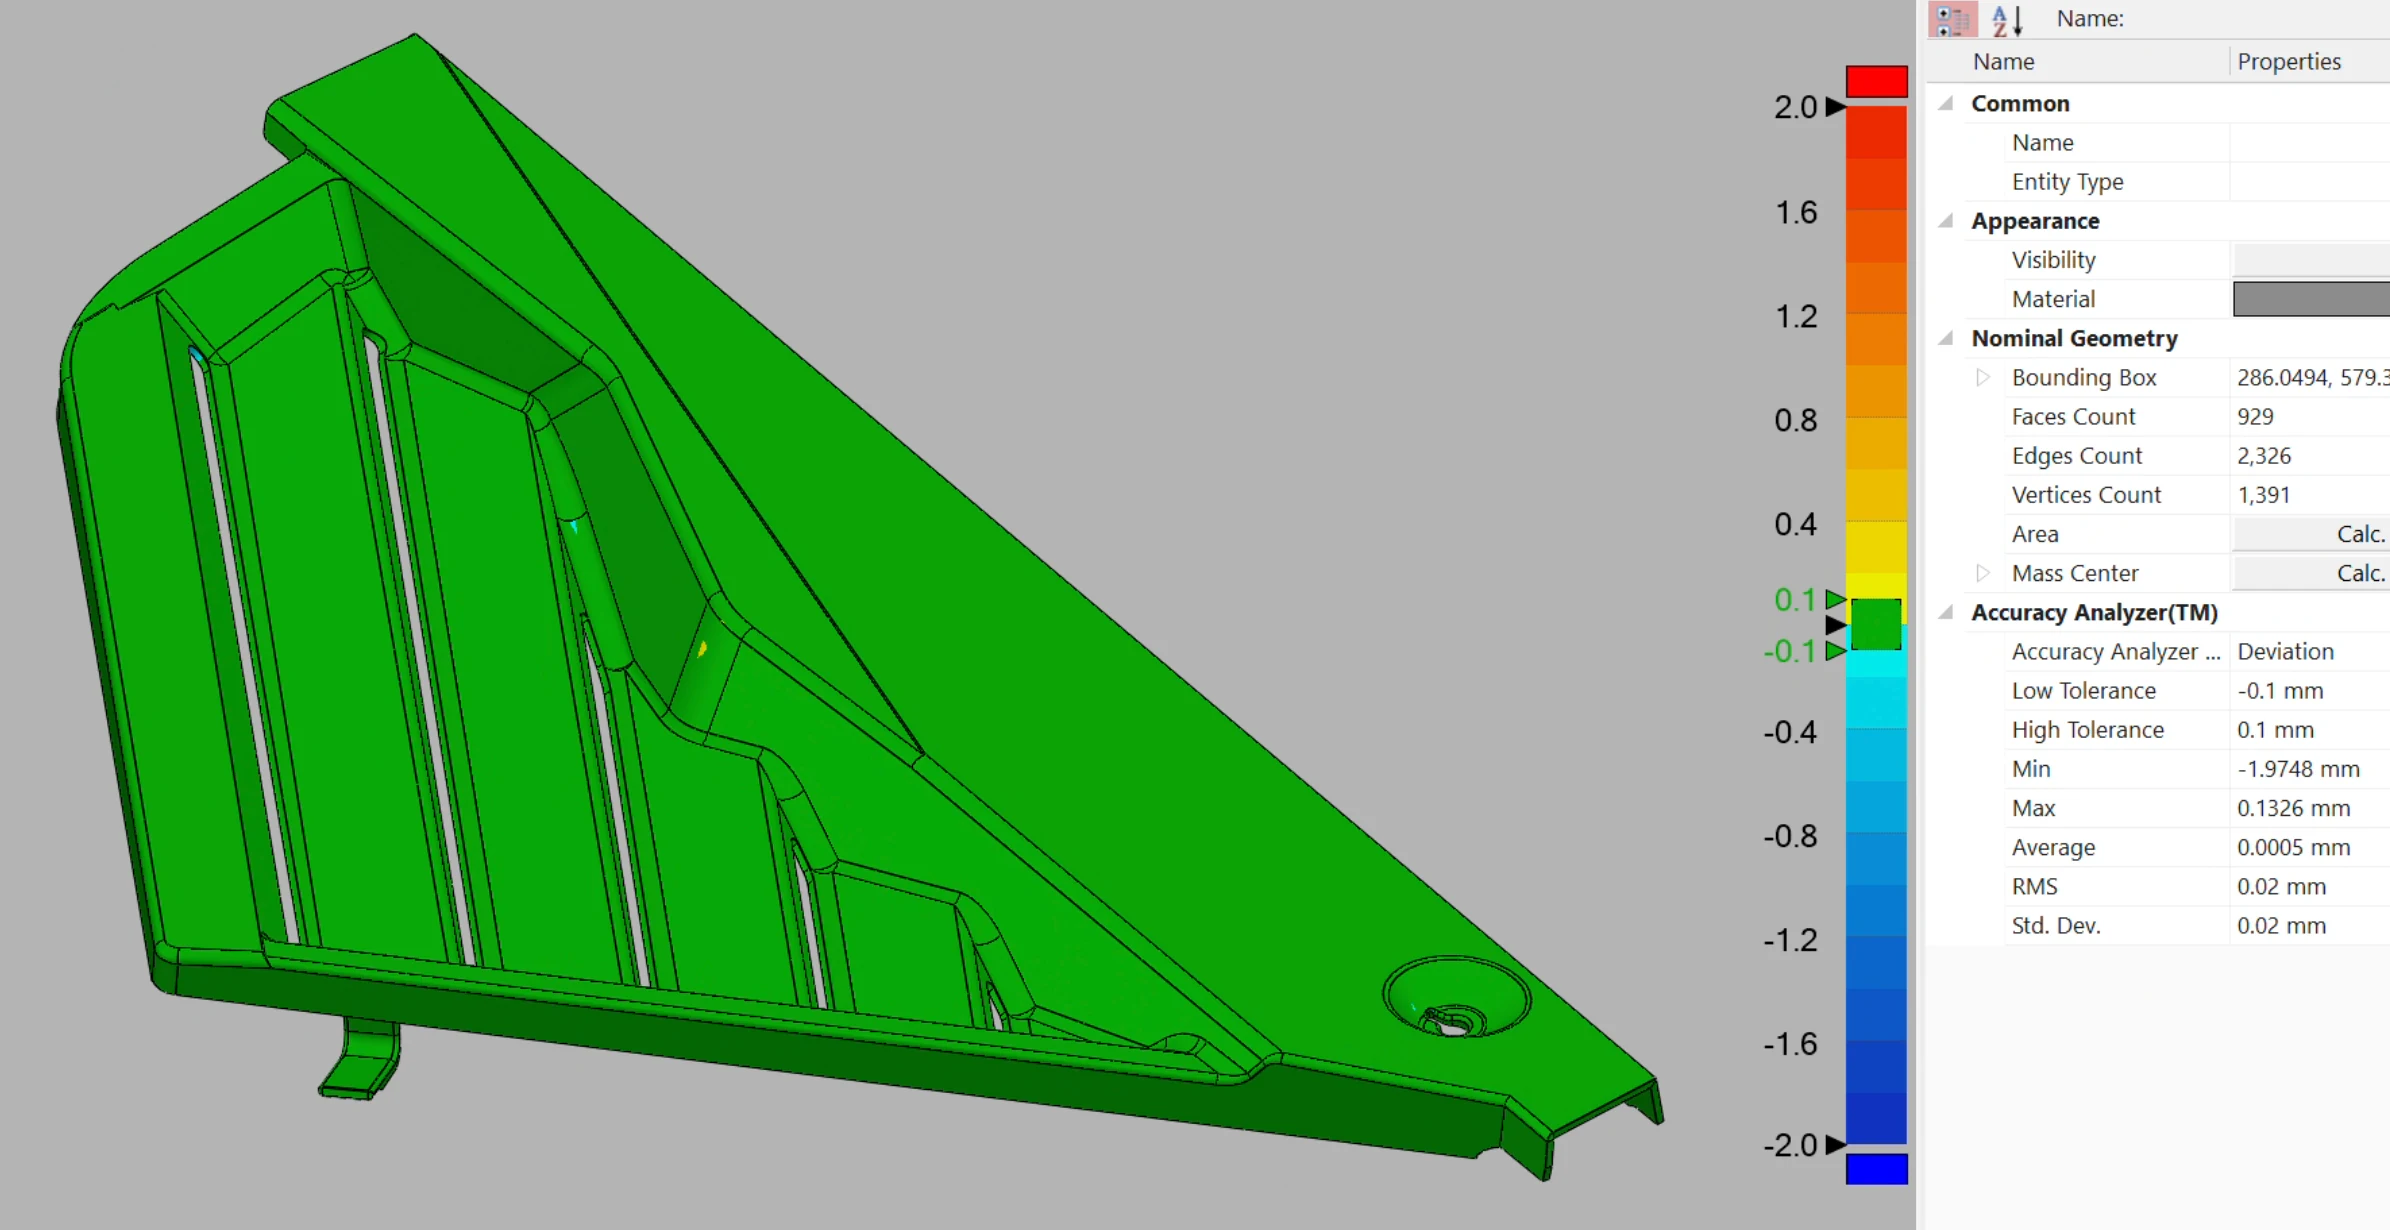
These educational examples show scan imagery, reconstructed CAD, and deviation visualization. Project-specific conclusions require an agreed reference and review scope.
Move the slider to see the relationship between the captured scan image and the reconstructed CAD example.
Comparison context
A useful comparison identifies both geometry sets, the visualization scale, and any areas selected for further review.
 Near reference
Edge review
Near reference
Edge review
Color is not a pass/fail verdict by itself. A responsible comparison identifies the measured dataset, reference geometry, alignment method, displayed range, and the regions that matter to the decision.
State what was captured and what reference CAD, drawing, nominal model, or selected geometry is being used. A scan and a reconstruction can represent different intended conditions.
Best-fit, datum-based, feature-based, and local alignment can produce different visual results. The alignment should match the agreed question instead of being chosen only because it looks clean.
Colors show differences within a chosen scale. The requested tolerance, critical surfaces, coverage limits, and downstream decision determine whether a displayed area needs further review.